


As of May 5, 2025, Vietnam’s seafood exports have shown a robust recovery in the first four months of the year, reaching a total value of $3.3 billion, marking a 21% increase compared to the same period in 2024. In April alone, exports amounted to $850.5 million, up by 10%. However, the growth is uneven across different products and markets, especially in light of the U.S.’s retaliatory tariff policies posing significant challenges.
Key Export Products:
-
Shrimp: Continues to be the leading export, contributing $1.27 billion in the first four months, a 30% year-on-year increase. April exports reached $330.8 million, up 15%, driven by strong demand from major markets like China, the EU, and Japan, along with recovering global shrimp prices due to supply-demand rebalancing.
-
Pangasius (Tra fish): Maintains a significant position with $632.7 million in exports (up 9%), though growth has slowed, with April figures stagnant at $167.7 million.
-
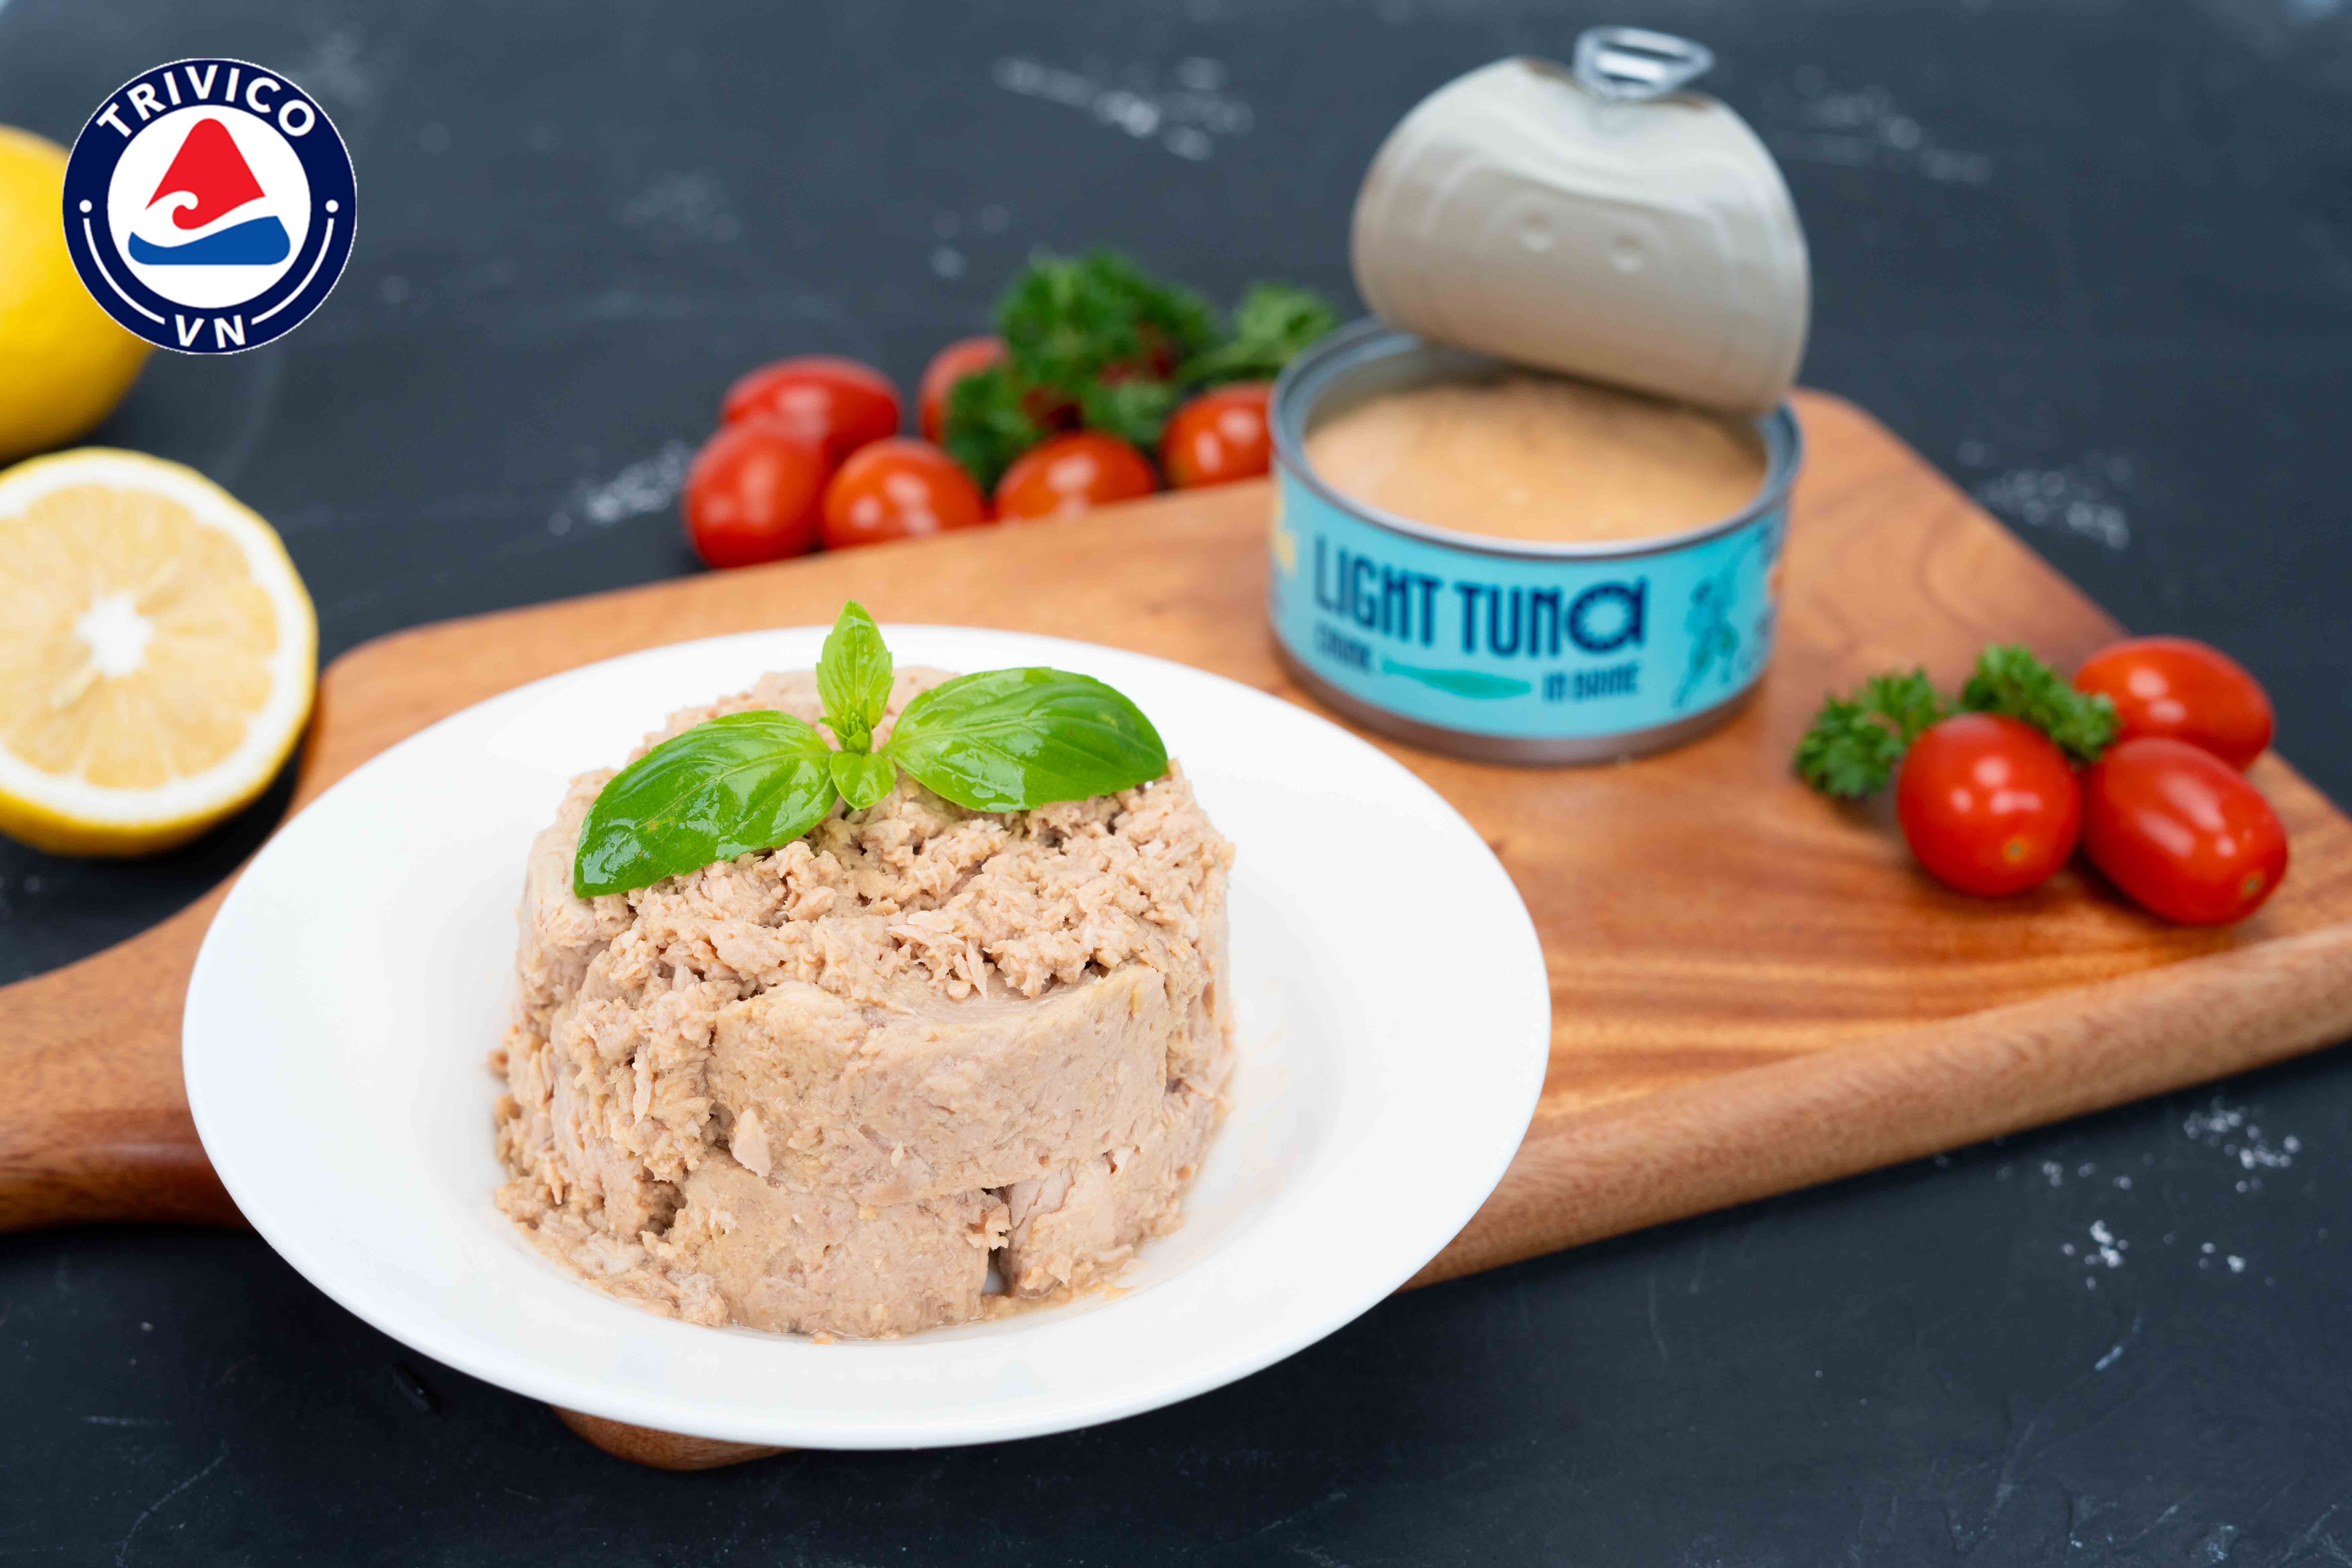
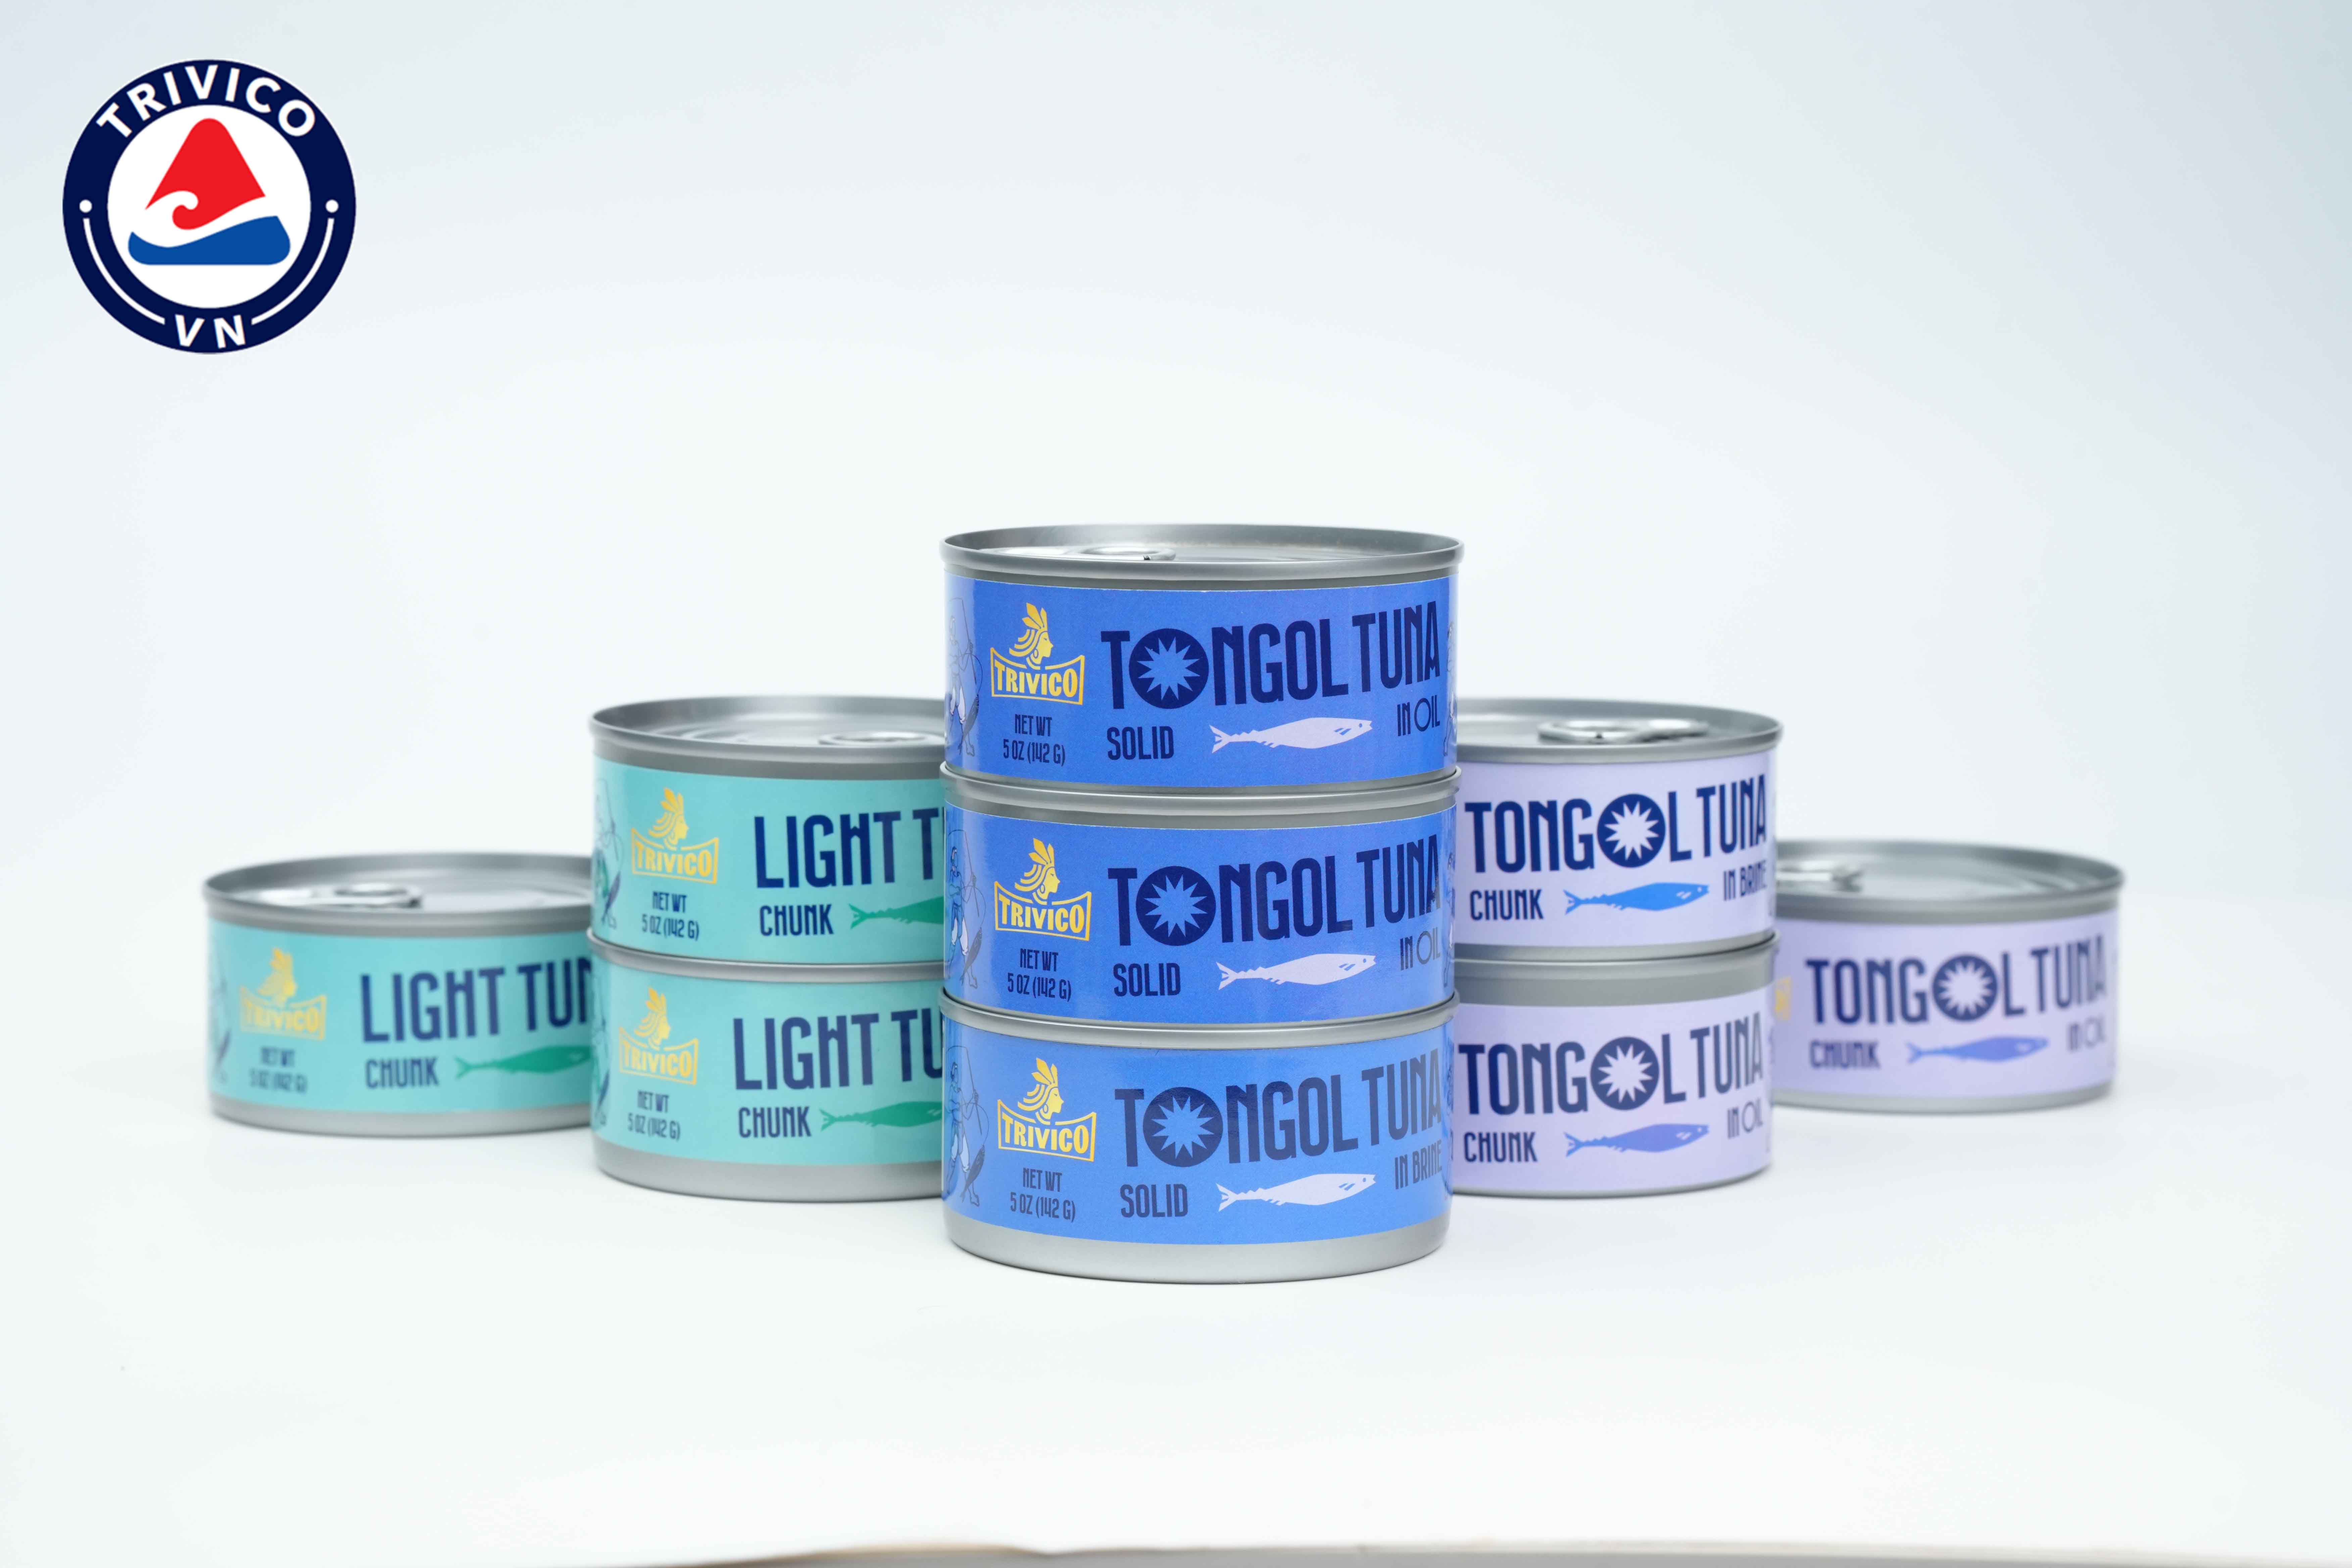
Tuna: Experienced a decline in April (down 12% to $76.1 million), but the cumulative four-month export value still shows a slight increase of 1% at $304.2 million. Production and exports have been constrained by raw material shortages, particularly due to regulations on the minimum size of skipjack tuna.
-
Other Products: Tilapia and red tilapia exports surged by 138%, reaching $19 million, albeit from a smaller base. Mollusks and crustaceans also saw impressive growth: cephalopods at $216.4 million (up 18%), shelled mollusks at $83.1 million (up 82%), and crabs and other crustaceans at $112.1 million (up 50%), fueled by high demand from China and ASEAN countries.
Market Dynamics:
-
China and Hong Kong: Lead with $709.8 million in exports over four months, a 56% increase. April alone accounted for $182.3 million, up 29%, primarily due to strong demand for shrimp, crabs, and mollusks in the premium segment.
-
Japan: Ranks second with $536.6 million (up 22%), showing stable growth thanks to value-added products.
-
EU and South Korea: Demonstrate potential with exports of $351.5 million (up 17%) and $264.1 million (up 15%), respectively, benefiting from preferential tariffs under the EVFTA.
-
United States: Exports reached $498.4 million (up 7%) over four months, but April saw a 15% decline to $120.5 million. This downturn reflects the impact of current U.S. retaliatory tariffs, disrupting export activities.
-
ASEAN: Emerges as a bright spot with $218.8 million in exports (up 25%).
-
Middle East: Experienced an 8% decrease due to lower consumption demand.
Challenges from U.S. Tariffs:
The U.S. has imposed high anti-dumping duties, up to 46% on certain Vietnamese seafood products, exerting significant pressure on exports, particularly shrimp and pangasius, which heavily rely on the U.S. market. These tariffs increase product costs, prompting U.S. importers to consider alternative sources like India and Ecuador. Additionally, stringent technical barriers, such as food safety inspections and strict traceability requirements, further erode Vietnam’s competitive edge.
Strategic Responses:
Vietnam is leveraging trade agreements like the CPTPP and other FTAs to mitigate negative impacts by expanding into markets such as the EU, Japan, and ASEAN. Vietnamese enterprises are also adjusting their strategies to focus on value-added products and market diversification to reduce dependence on the U.S.
Outlook for May and June 2025:
With new U.S. retaliatory tariffs set to take effect on July 9, 2025, Vietnamese seafood exporters are expected to accelerate shipments to the U.S. in May and June, especially for key products like shrimp and pangasius, to capitalize on the window before increased costs take hold. Export value to the U.S. is projected to rise by 10-15% compared to April 2025, driven by expedited contract signings and competitive pricing strategies to maintain market share.
Conversely, exports to other markets like China and ASEAN may experience a slowdown, with growth rates around 3-5%, due to intensified competition from Chinese seafood products redirected from the U.S. market. This competition could diminish the appeal of Vietnamese products, particularly in the low-cost segment. The EU and Japan are expected to sustain stable growth (approximately 8-10%), supported by advantages from free trade agreements, though this may not fully offset the deceleration in China and ASEAN markets.
Export Statistics for April and January–April 2025:
| Product Category | April 2025 (USD million) | Change (%) | Jan–Apr 2025 (USD million) | Change (%) |
|---|---|---|---|---|
| Shrimp (all types) | 330.8 | +15% | 1,269.3 | +30% |
| Pangasius | 167.7 | 0% | 632.7 | +9% |
| Tuna | 76.1 | -12% | 304.2 | +1% |
| Other fish | 173.2 | +15% | 679.6 | +20% |
| Tilapia & Red Tilapia | 5.2 | +158% | 19.0 | +138% |
| Cephalopods | 55.5 | +26% | 216.4 | +18% |
| Shelled mollusks | 20.1 | +29% | 83.1 | +82% |
| Other mollusks | 0.6 | -15% | 2.2 | +5% |
| Crabs & other crustaceans | 26.6 | +17% | 112.1 | +50% |
| Total | 850.5 | +10% | 3,299.7 | +21% |
Source: Vietnam Association of Seafood Exporters and Producers (VASEP)